WBS - Part 2 - Data Visualization(Public Sector: Defense & arms trade)

In part 1 we did some cleaning and data manipulation , now let make some good used of that data.
In last tutorial we had 1477 row of data of Public Sector: Defense & arms trade--(topic).
Lets built some visualization that is interesting and lucid.
We will make google motion chart (like Hans) and dashboard in Tableau.

This data.frame is still not ready as input for visualization. Lets make it.
Things to remember
1. Always make date in narrow format, it will make many thing easy for all type of visualization(pivot table, tableau , motion chart), as date are mostly used as filter, its a good practices.
2.  Expand those factors which can be made into individual column and we can analysis each column separately (like indicator name here, we can make column of each indicator so that we can analysis only one indicator at a time). This will give as more flexibility for analysis. This is good practices in any type of analysis (pivot, tableau, others)


####lets gather all data into narrow form wdi_sub = gather(wdi_sub, "years", "sample", 4:59)
#### Rename for easy handling
colnames(wdi_sub) <- c("Indicator.Name", "Country.Name","Region" ,"years", "Value")
#### lets put indicator name in column name
wdi_sub = dcast(wdi_sub, Country.Name+years+Region~Indicator.Name, value.var = "Value", na.rm = T )

One important requirement of google motion chart is it need one variable as date, so lets make years to data variable in r
###add month and day
wdi_sub
$years = paste(wdi_sub$years,"-01-01", sep="")
wdi_sub$years=as.Date(wdi_sub$years, "%Y-%m-%d")

Now we are ready
Few function input has to be define other can be change from chart itself gvisMotionChart -- parameters
###google motion chart
M
= gvisMotionChart(wdi_sub, idvar = "Country.Name", timevar = "years", colorvar = "Region",
options = list(width = 700, height = 600), chartid= "country_gdp")
plot(M)
###save file
setwd(filepath)
dir.create("Output")
setwd(paste(filepath, "Output", sep="/"))
write.csv(wdi_sub, file="Public Sector: Defense & arms trade.csv")
setwd(filepath)
rm(list=ls())

This is the plot you will get as output: Public Sector: Defense & arms trade.html

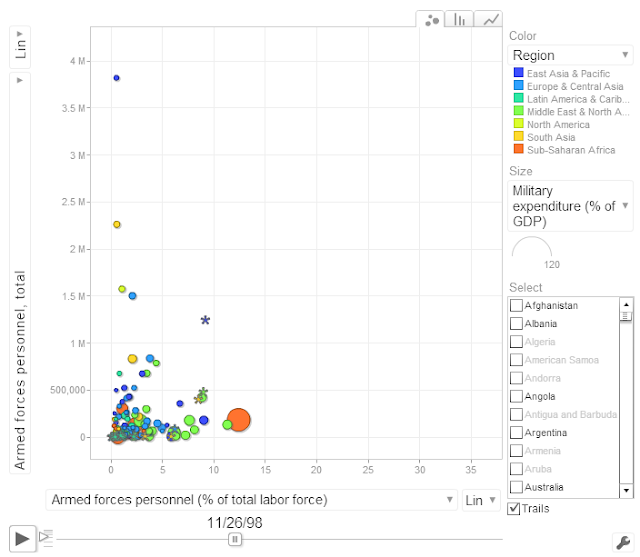
Play around with it, change axis, color, size var as you like.

This is format of data used for google motion chart (same file will be used to make tableau dashboard, and you can even use it to make pivot table)
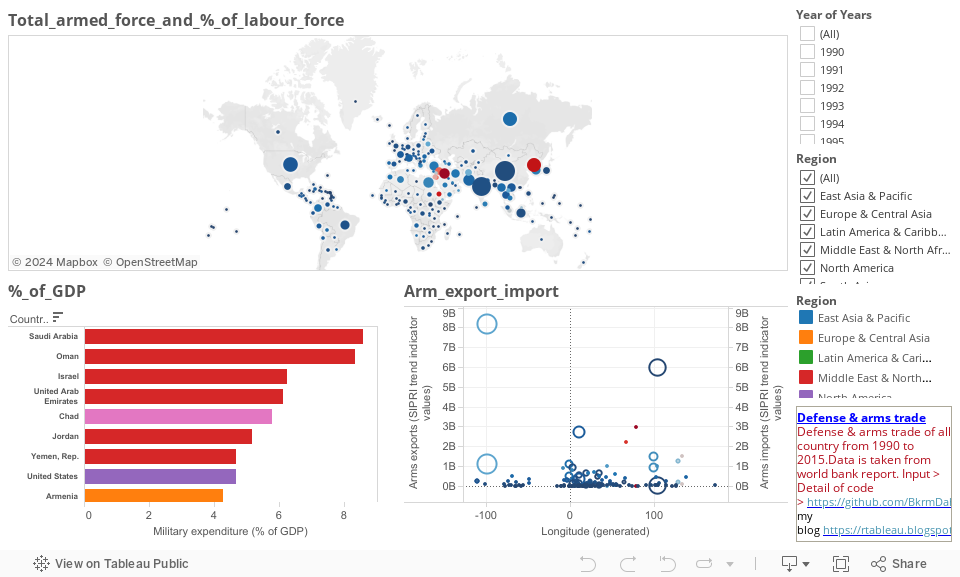

Tableau
Import the saved file to Tableau and change the format of all numerical filled to numeric ( as data has NA these field will be marked as text by tableau). You can download the workbook from Military_Expenditure(Defense arms trade) and follow along.


World Bank Series - Part 1 - Data Cleaning and Manipulation

Let get some open data to play around. World Development Indicators from World bank is good datasheet to get us started.
First download the World Development Indicators from Worldbank Data 
Download the CSV format >>> Data catalog downloads (Excel | CSV)(45 mb)
Once download completes unzip the file to you desired directory.
My is "M:/R_scripts/Combine"
Let set out R directory to same folder
setwd("M:/")
filepath=getwd()
setwd(paste(filepath, "R_Script/Combine", sep="/"))

Now lets load the required packages

##if (!require("dplyr")) install.packages('dplyr') # if you are not sure if package is installed
suppressPackageStartupMessages(require("dplyr"))
suppressPackageStartupMessages(require("tidyr"))
suppressPackageStartupMessages(require("reshape2"))
suppressPackageStartupMessages(require("readr"))
suppressPackageStartupMessages(require("googleVis"))
currentDate = Sys.Date()

Read three files 
1. WDI_data -- has all data 
2. WDI_country -- has info about country
3. WDI_country --  has info about Indicators
#####readfile from your directory
wdi
= read_csv("WDI_Data.csv")
country = read_csv("WDI_Country.csv")
i_name= read_csv("WDI_Series.csv")
str(wdi) # To see structure of data


First thing you will notice is that WDI_Data has more than 333000 obs. which is large-set of data.
Second thing is that its has data from 1960 to 2015, which is also long duration.
Third thing is country name has name like Arab world, low income, which as you guessed are not country name
*str(wdi)
Classes ‘tbl_df’, ‘tbl’ and 'data.frame': 333560 obs. of  60 variables:
 $ Country Name  : chr  "Arab World" "Arab World" "Arab World" "Arab World" ...
 $ Country Code  : chr  "ARB" "ARB" "ARB" "ARB" ...*

Lets start data cleaning 
Few point to always keep in mind
1. In data.frame or any database column should have similar variables i.e if col name is country name than its better it has only country name.
2. Try your best to put other info into separate column like, arab world looks like classification of country by region and low income by income gap, so its better to have separate column as region and income gap.

Let see head i.e first 10 row all data sheet and see what other data.frame have
##see first 10 rows country
head(country)

This table seems helpful to find only country from WDI table.
Here you see country_name, region and income gap. We can join these two table to get only country from WDI. But there is small problem in row 8 you can see there is arab world that should not be name of country. Solution if you see column "Currency unit", you see its NA for Arab world, so if currency name is "NA" than its not country. Lets get subset of country with country name and with currency unit only.
##lets run anysis on country name only; #country name in wdi file has other names like summary of region
country_sub
= subset(country, country$`Currency Unit`!="" ,
select = c("Table Name", "Region")) # if currency unit is blank its not country
colnames(country_sub) <- c("Country Name", "Region")

Lets only keep required col names in wdi
#### create subset of above data, select only required row
wdi_sub
= wdi[ , c(1,3,5:60)]

Now lets left_join to get only country name
####let join all data to get only required data
wdi_sub
= left_join(country_sub, wdi_sub)

But still we have 283798 row of data which is to much info for any analysis
If you see col "Indicator Name" its seems way to subset data and few names look like of some category 
Let explore more data.frame
##see first 10 rows country
head(i_name)

This data.frame has Topic and category name, Its seems another good way to get sub-category. Lets get only one topic at a time.
##lets get only one Topic
i_name_sub
= subset(i_name, i_name$Topic=="Public Sector: Defense & arms trade", select="Indicator Name")

Other way of  making subset of data is by selecting multiple Indicator Name
##OR get multiple Indicator
#to remove multiple comment just select line click shif+ctrl+c
# i_name_sub = subset(i_name,

i_name$`Indicator Name`=="GDP growth (annual %)" |
i_name$`Indicator Name`=="Population density" |
i_name$`Indicator Name`=="CO2 emissions (kt)" |
i_name$`Indicator Name`=="Access to electricity" |
i_name$`Indicator Name`=="Forest area (% of land area)" |
i_name$`Indicator Name`=="Inflation, consumer prices" |
i_name$`Indicator Name`=="Life expectancy at birth" |
i_name$`Indicator Name`=="Birth rate, crude (per 1,000 people)" , 
select="Indicator Name")
At last lets left_join to get data of only required topic

####let join all data to get only required data
wdi_sub = left_join(i_name_sub, wdi_sub)

Finally its has only 1477 row and only related data. We  are ready for analysis.


Softwares and Setup for Analysis (R)

Let start by downloading all software and setting up few accounts.

Software to download
1.  -- Programming language for statistician by statistician 
2. -- IDE for R
3.-- Data Visualization Tool

Make account on 
1.  --  Distributed revision control and source code management
2.  -- Markdown(HTML, pdf report from R) hosting site
3.  -- Hosting your Tableau public workbook.

Once everything is set up open R studio and choose which R version you want to use whether 64bit/32 bit (you can change version later from R studio if you want) choose 32bit as 64bit has some issue while using  package like mailR, ODBC etc. You can change to 64bit version when you need from Rstudio UI. 

Once everything is step up go through few basic tutorial on YouTube or Datacamp.
Few best resources to learn basic of R:
1. TryR
2. Datacamp -- play and learn R
3. The Analytics Edge | Edx -- Edx course, its very very useful 
4. R-programming | Coursera -- Learn from fundamental  
5. R-bloggers --  Content collected from bloggers
6. R_books -- list of all useful R book.
4. Online-learning_R -- Blog post 

Advice: Don't try to be export(i.e  learn everything)  before writing program, after learning basic, try to write code that helps you in your work, you will write shit code ( when i see my old code I feel that too) but you will learn very fast. 
If you are not able to solve anything just google it, you will find solution. You will find solution to simple problem like changing col names to writing complex loop in google, always give it try.

List of most useful packages in R
1. dplyr, tidyr, reshape2, stringr  -- Data manipulation( sqldf if you know SQL)
2. ggplot2, pploty, googleVis, htmlwidgets , shiny-- Data visualization 
3. Markdown -- Reporting

Just play around with few packages, you will get hooked to them as they make you life so easy. Just few line of code and you will have beautiful visualization , cleaned data and summary of data.
Now we are all set to start automating and producing beautiful /lucid visualization. 


What I like in twitter

Contact Form

Name

Email *

Message *